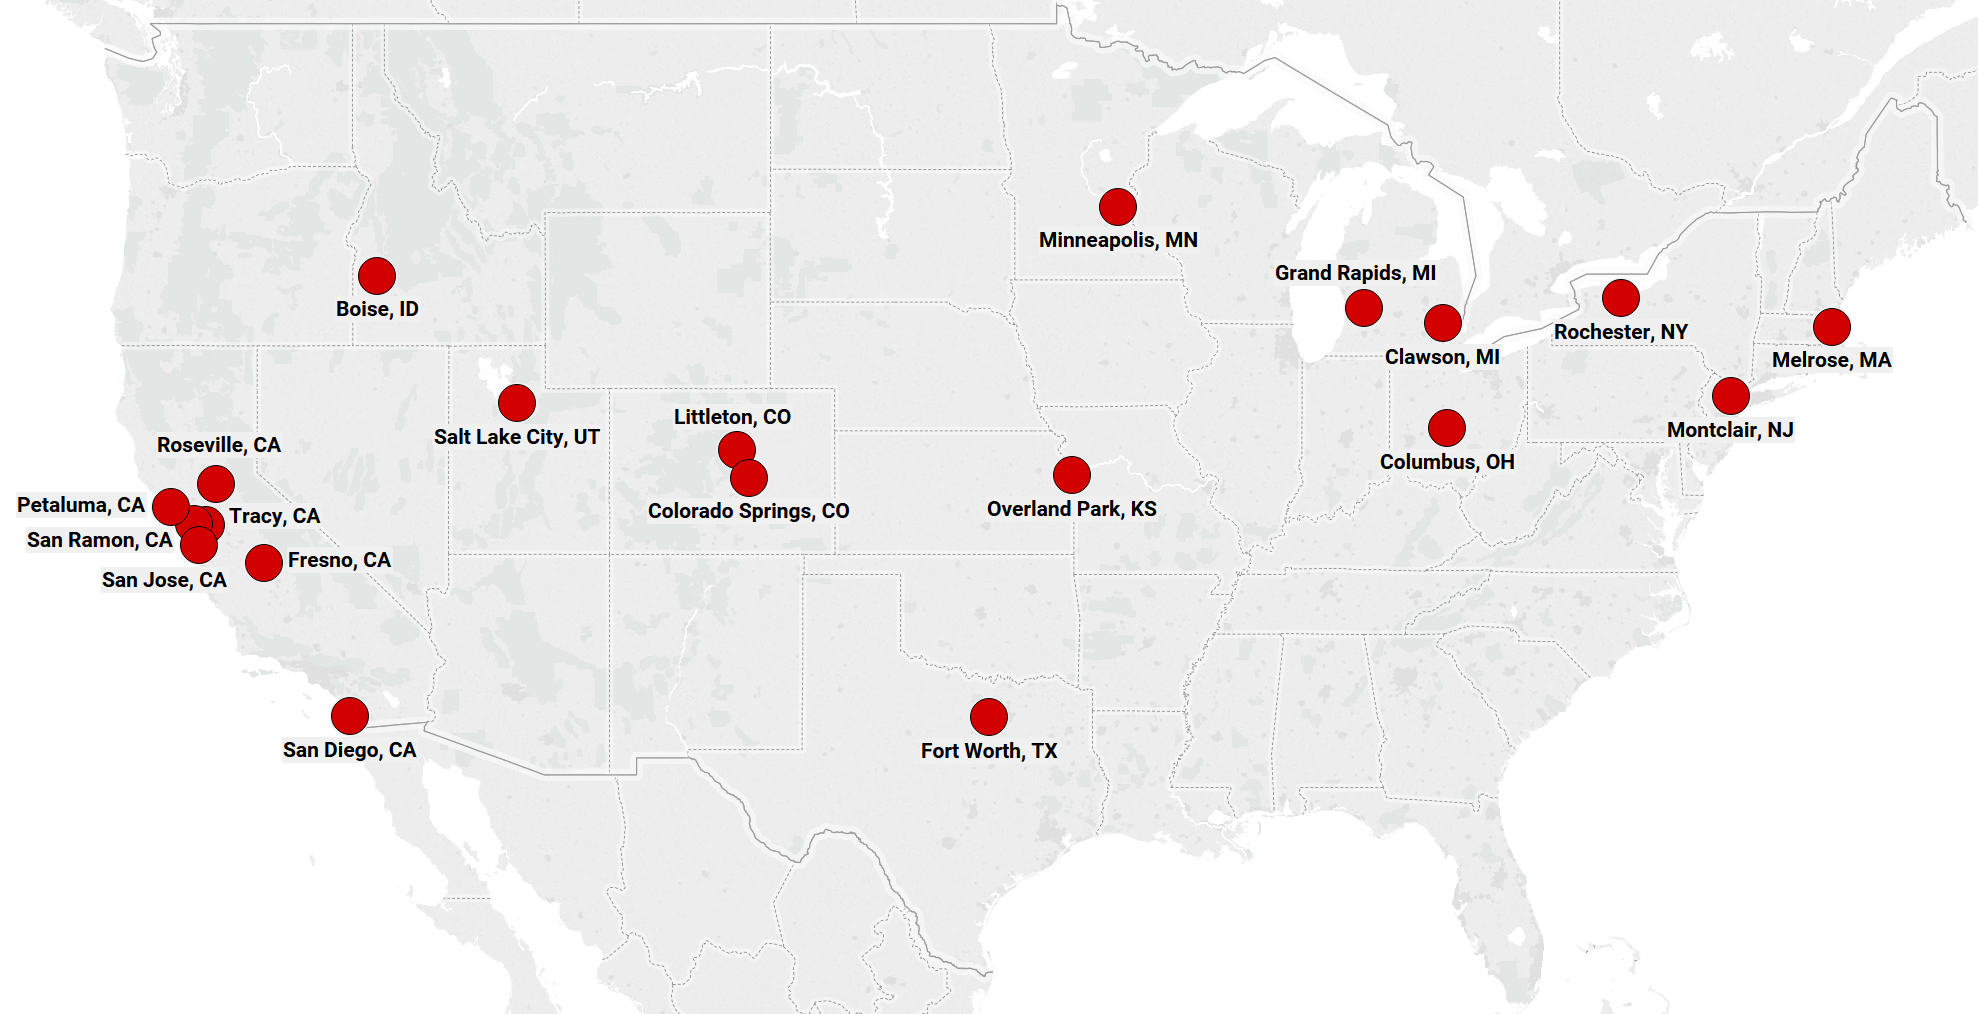
We analyzed 16,000 zip codes based on the time it takes properties to sell and how frequently homes are viewed in each zip code. Homes in the top 20 zips were selling very fast, averaging 21 days on the market. This is 57 days faster than the national rate of 78 days during the first quarter of the year.
The hottest zip codes in the first quarter of 2018 show a geographically diverse spread, with 12 different states represented in the top 20 zips.
Colorado Springs, CO (80922) tops the list of hottest zips, with Fort Worth, TX (76148), San Ramon, CA (94583), Melrose, MA (02176), and Littleton, CO (80128) rounding out the top five.
Some surprises among the usual suspects
Overland Park (66212) in Kansas City was a bit of a surprise, edging into the top 10. The Kansas City metropolitan area itself has been hot this spring, and Overland Park is leading the pack in a new set of boiling hot neighborhoods in the Midwest.
If there is a dominant state, it’s California, representing seven of the top 20 zips. This massive amount of demand contributes to California’s increasingly challenging market for home buyers.
Colorado zips continue their hot streak highlighting the meteoric rise of Denver and its neighboring metros over the past decade – a pattern that other markets hope to replicate. In fact, we speculated as to whether Salt Lake City, UT is the ‘New Denver’ earlier this year and now we see Salt Lake City breaking into the top 20 zips.
Homes in the top markets are relatively affordable
The median price for a home in these markets was $377,000 – 1.4 times more than the national median during Q1 – with prices in 11 of the top 20 zips exceeding the national average. However, when compared to their immediate surrounding metro area, the median home listing price is lower in 14 of the top 20 zips.
Top 20 Hottest Zip Codes – Q1 2018
| Rank | Zip Code | Zip Name | Metro | Median Listing Price | Days on Market |
| 1 | 80922 | Colorado Springs, CO | Colorado Springs, CO | $293,700 | 15 |
| 2 | 76148 | Fort Worth, TX | Dallas-Fort Worth-Arlington, TX | $176,867 | 16 |
| 3 | 94583 | San Ramon, CA | San Francisco-Oakland-Hayward, CA | $923,113 | 16 |
| 4 | 02176 | Melrose, MA | Boston-Cambridge-Newton, MA-NH | $569,433 | 24 |
| 5 | 80128 | Littleton, CO | Denver-Aurora-Lakewood, CO | $432,050 | 11 |
| 6 | 14623 | Rochester, NY | Rochester, NY | $126,908 | 19 |
| 7 | 49508 | Grand Rapids, MI | Grand Rapids-Wyoming, MI | $183,575 | 19 |
| 8 | 95111 | San Jose, CA | San Jose-Sunnyvale-Santa Clara, CA | $725,641 | 14 |
| 9 | 92126 | San Diego, CA | San Diego-Carlsbad, CA | $562,383 | 22 |
| 10 | 66212 | Overland Park, KS | Kansas City, MO-KS | $222,588 | 25 |
| 11 | 83704 | Boise, ID | Boise City, ID | $242,607 | 28 |
| 12 | 55434 | Minneapolis, MN | Minneapolis-St. Paul-Bloomington, MN-WI | $227,783 | 22 |
| 13 | 43085 | Columbus, OH | Columbus, OH | $306,074 | 29 |
| 14 | 48017 | Clawson, MI | Detroit-Warren-Dearborn, MI | $180,808 | 28 |
| 15 | 93710 | Fresno, CA | Fresno, CA | $262,367 | 21 |
| 16 | 95678 | Roseville, CA | Sacramento–Roseville–Arden-Arcade, CA | $419,914 | 25 |
| 17 | 95391 | Tracy, CA | Stockton-Lodi, CA | $654,944 | 21 |
| 18 | 07043 | Montclair, NJ | New York-Newark-Jersey City, NY-NJ-PA | $785,867 | 26 |
| 19 | 94952 | Petaluma, CA | Santa Rosa, CA | $855,383 | 26 |
| 20 | 84123 | Salt Lake City, UT | Salt Lake City, UT | $288,842 | 21 |
You can explore the full list of hottest zip codes on our Market Hotness Page
Methodology
The Realtor.com Market Hotness Index exposes how local areas are experiencing fast moving supply and rising demand. Using proprietary insights on buyer activity and the most comprehensive data on active inventory, the analysis breaks down demand and supply dynamics to rank metro areas, counties and zip codes relative to the rest of the country.
Realtor.com examined listing views by market as an indicator of demand and median days on market as an indicator of supply. This analysis led to the identification of the 20 hottest medium-sized to large markets in the country, selecting the top zip code from each metro area. Since this approach is calculated each month, we averaged monthly data across the quarter to compute these rankings.


